The Problem
Built around process logic,
not human logic.
Annual leave booking is one of the most fundamental HR interactions a colleague has — yet it was generating disproportionate frustration, helpdesk contacts, and manager overhead at Barclays. The experience had been built around process logic rather than human logic, and it showed.
Before we could fix anything, we needed to understand precisely what was broken, for whom, and why — across three countries with very different employment contexts, cultural expectations, and technical environments.
01
No research baseline
Decisions about the annual leave experience had been made on assumptions and stakeholder opinion rather than evidence from the people actually using it.
02
Two distinct user groups
Colleagues and people leaders had fundamentally different needs — but the platform treated them almost identically, optimising for neither.
03
Global complexity
Annual leave rules differ significantly between UK, India and US — yet the research needed to surface insights that could drive a coherent platform strategy.
The Approach
Research that can't be acted on isn't research — it's theatre. Every design decision in this study was made in service of producing insights that stakeholders could actually use.
— Research principle that shaped the programme design
The programme was designed as a mixed-methods study — combining quantitative scale with qualitative depth. The quantitative layer gave us statistical confidence; the qualitative layer gave us the why behind the numbers. Neither was sufficient alone.
Unmoderated Maze study — 174 responses
A structured unmoderated test measuring task completion, navigation patterns, comprehension, and satisfaction across both colleague and people leader paths.
Split: Separate paths for colleagues and people leaders, with role-specific tasks reflecting real annual leave scenarios in each country context.
Moderated 1:1 interviews
In-depth sessions exploring the emotional experience, workarounds, and unmet needs that quantitative data alone can't surface.
Structure: Semi-structured interview guide with scenario-based prompts, allowing participants to direct the conversation toward what mattered most to them.
Global sampling — UK, India, US
Participants stratified by role level, tenure, team size, and country — to ensure findings were representative rather than dominated by any single population.
Challenge: Controlling for country-specific leave rules while surfacing platform-level issues that applied universally.
Navigation label study — embedded
First-click testing embedded within the Maze study, specifically testing "Managing Teams" vs "Leading Teams" — with confidence ratings to distinguish guesses from confident choices.
Purpose: Resolve a contested IA decision with directional evidence rather than stakeholder opinion.
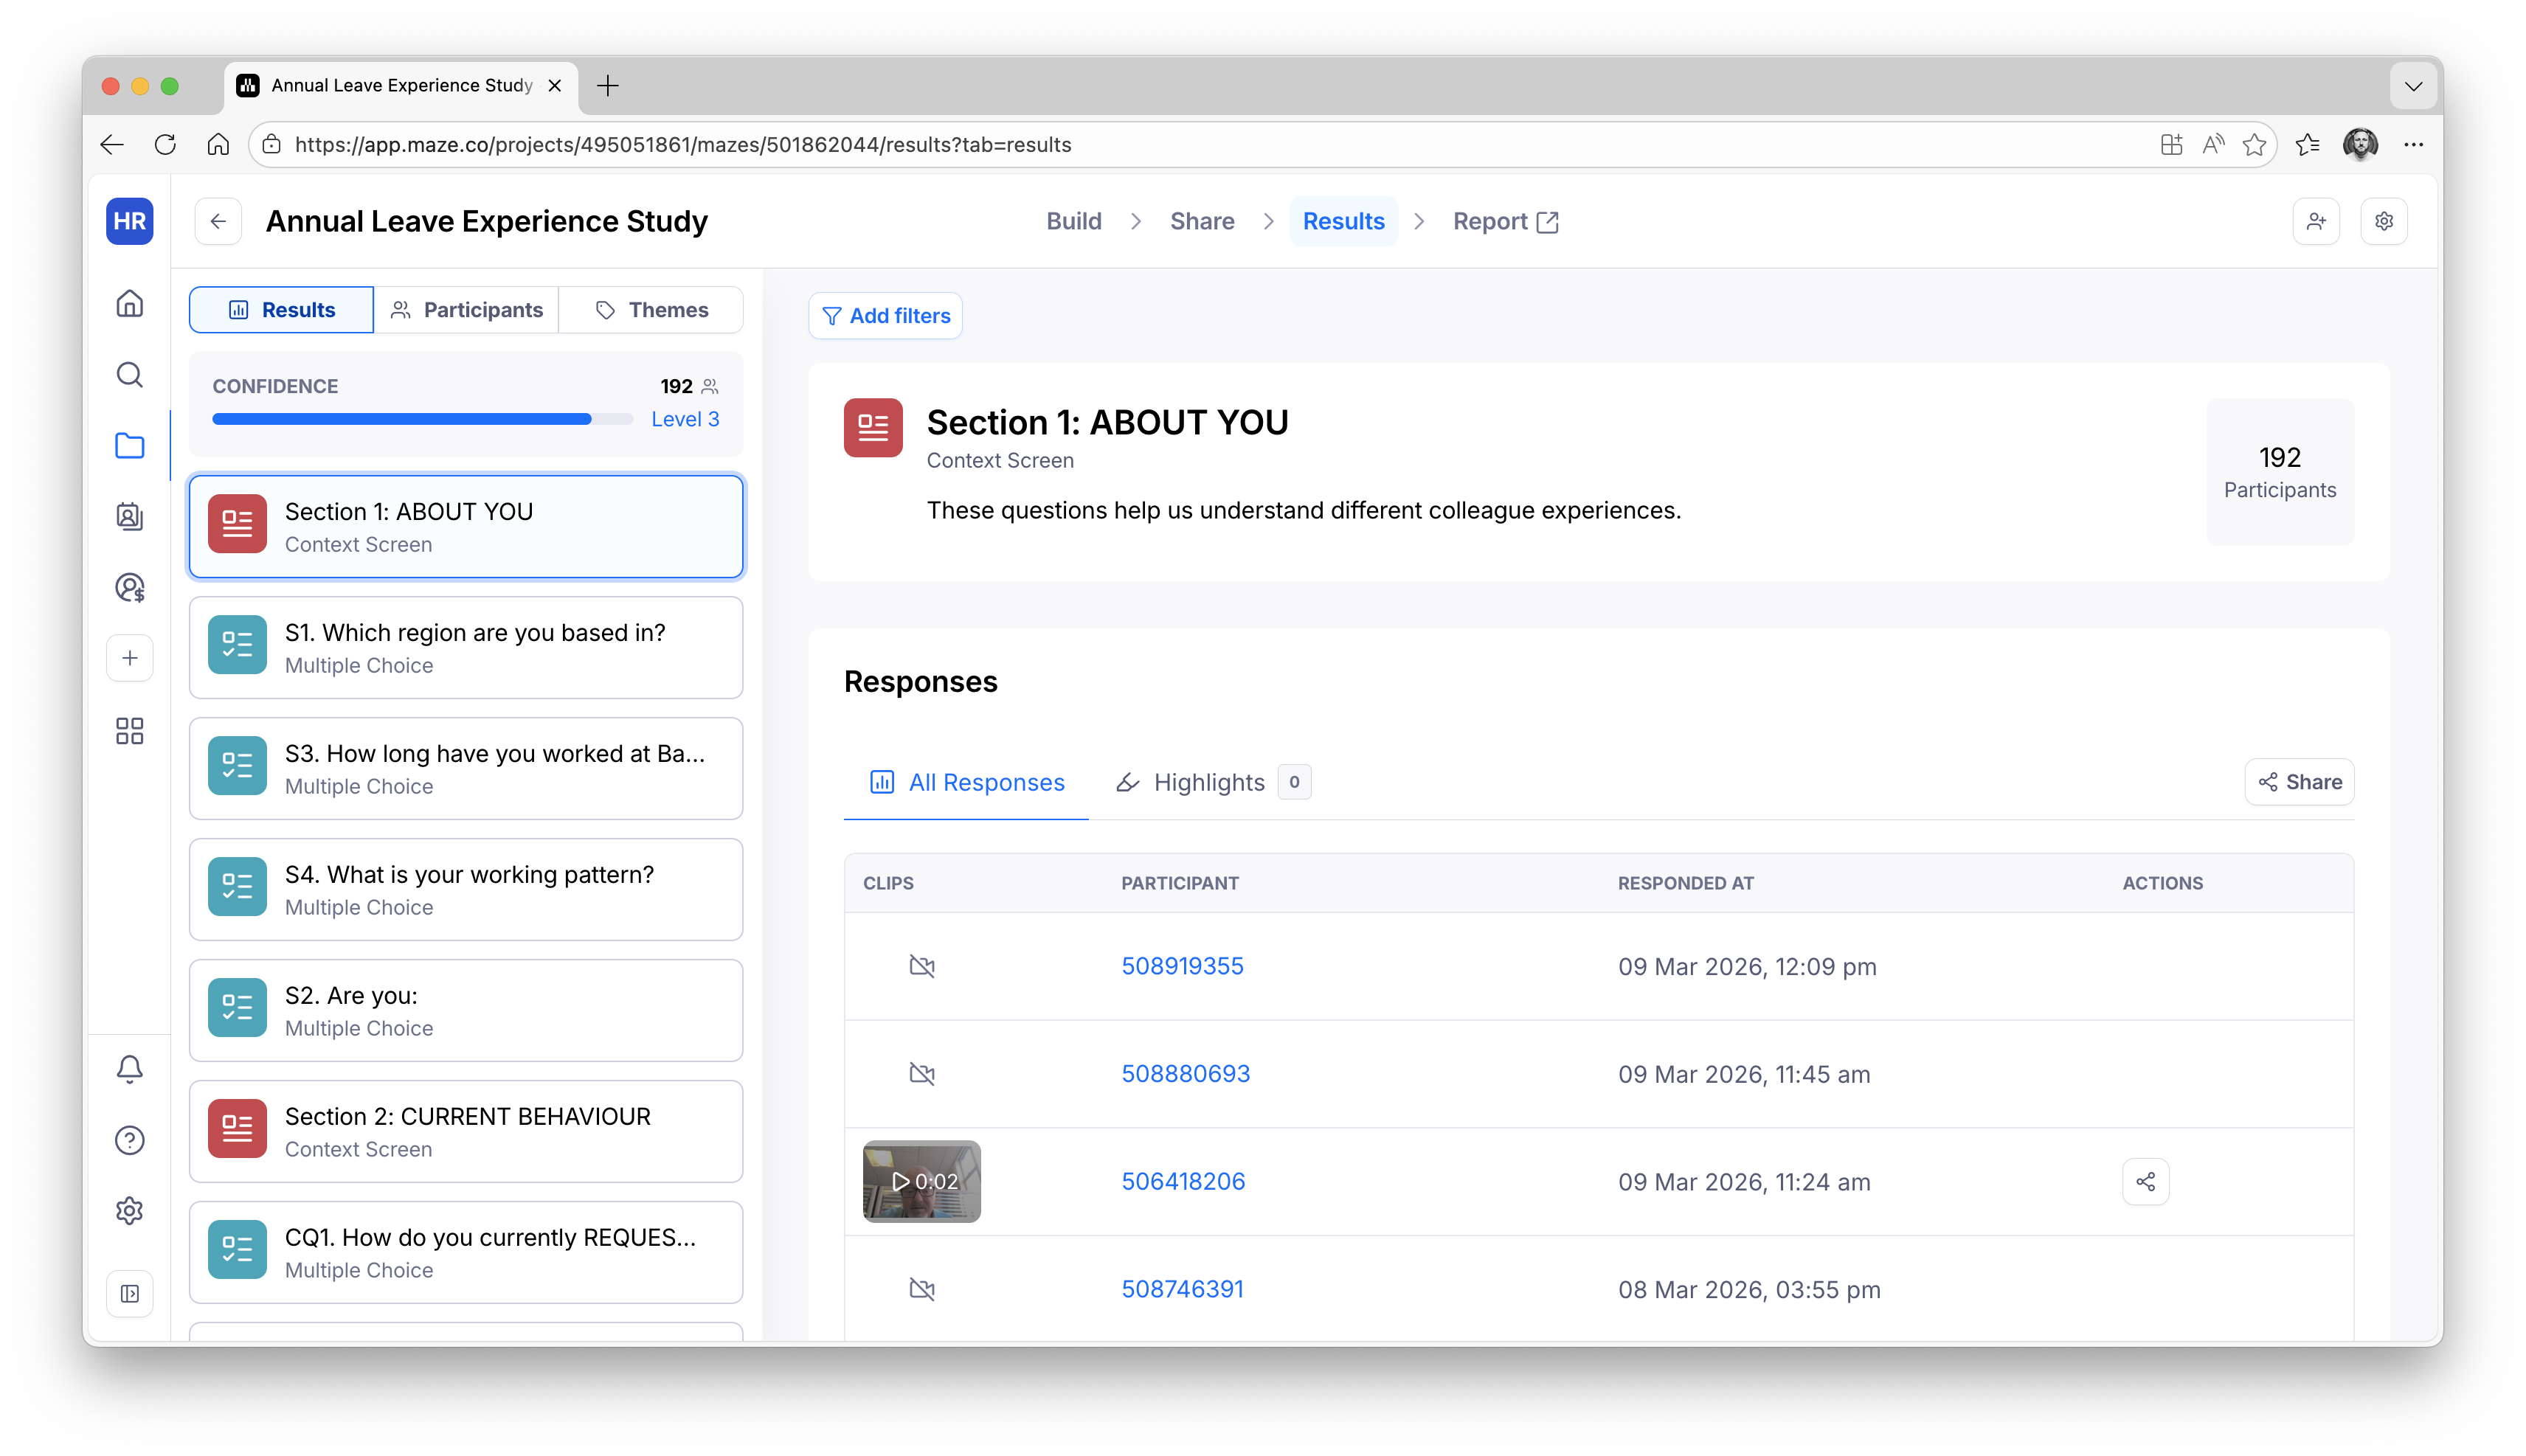
The Maze study dashboard — 192 participants, structured across colleague and people leader paths with branching logic
Key Findings
What the data
actually said.
01 — Navigation was the primary failure point
The majority of task failures occurred before participants reached any functional element — they couldn't find the right section, not because the feature was broken, but because the IA didn't match their mental model.
02 — People leaders needed a fundamentally different experience
The overlap in needs between colleagues and people leaders was far smaller than assumed. Managers needed team-level visibility, approval workflows, and conflict management — none treated as primary use cases.
03 — "Leading Teams" significantly outperformed "Managing Teams"
Higher first-click accuracy and higher confidence ratings across all three countries. Clear directional evidence for a previously contested IA decision.
04 — India-specific complexity was underserved
The variety of leave types available to India-based colleagues created navigation and comprehension challenges not experienced elsewhere, pointing to a need for localised content and IA.
05 — The emotional cost was higher than expected
Qualitative sessions revealed genuine anxiety around leave management — colleagues uncertain about entitlements, managers worried about making mistakes. The platform was amplifying rather than reducing stress.
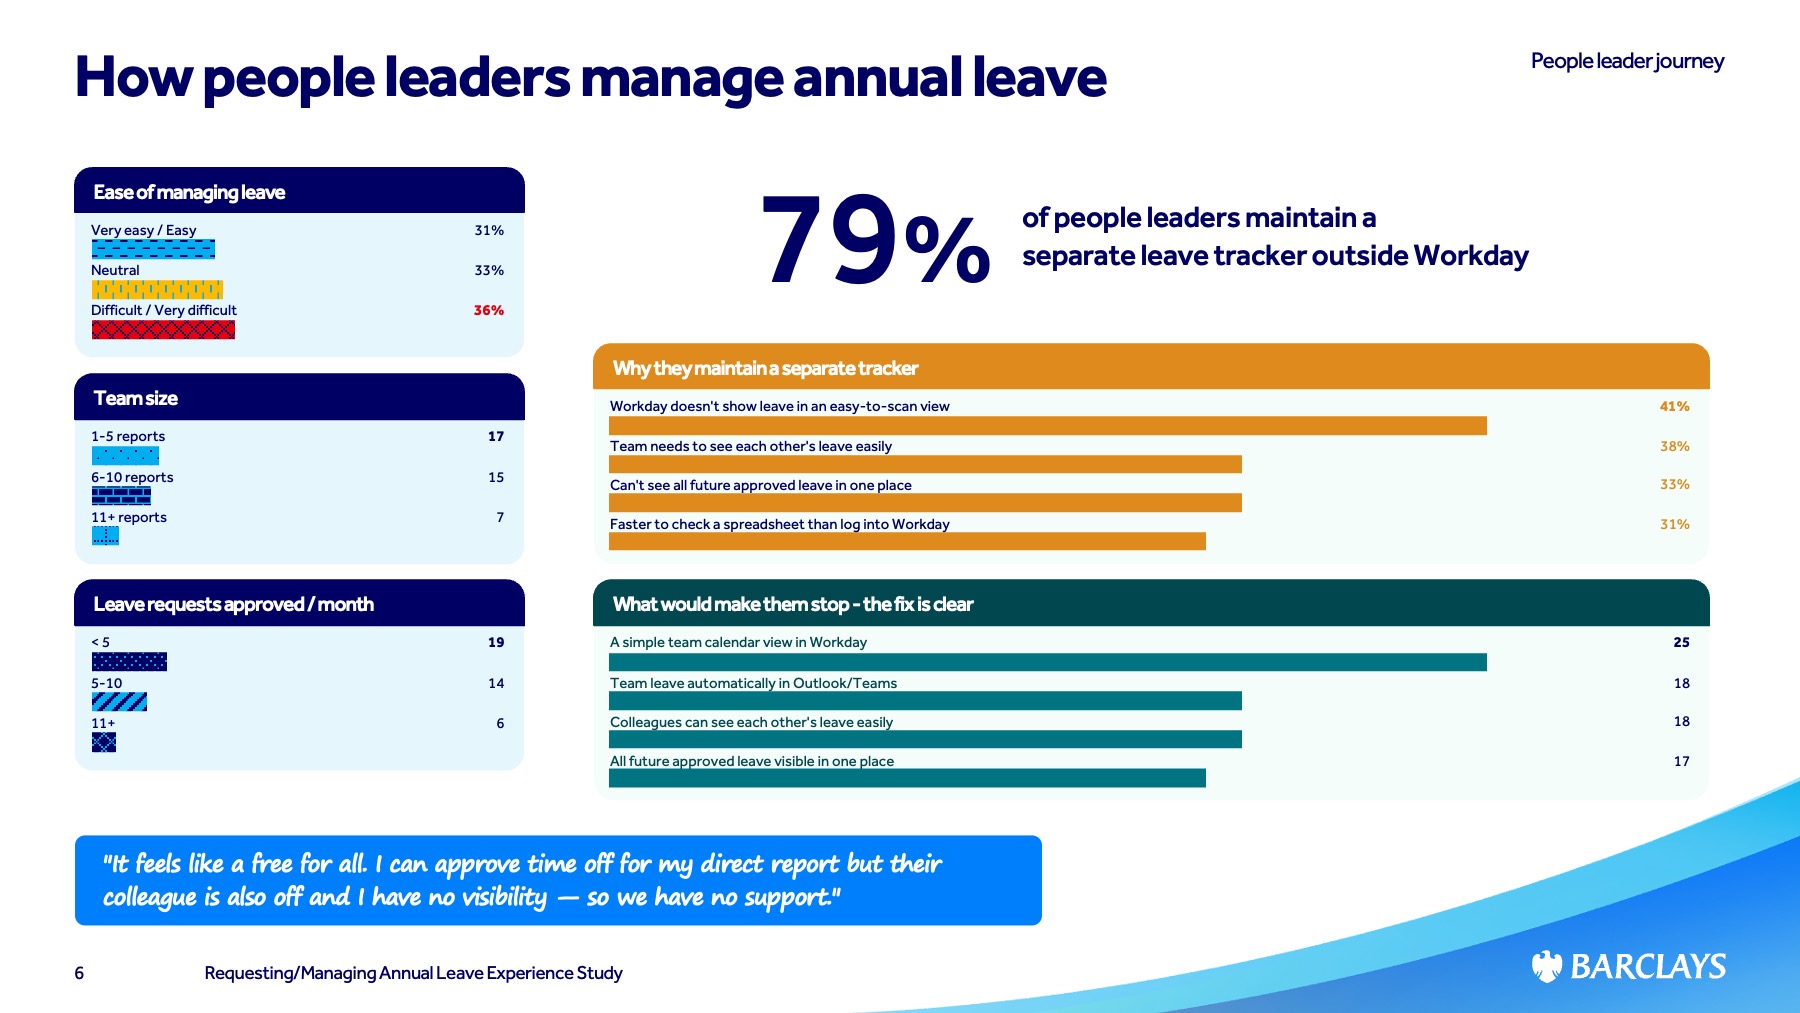
79% of people leaders maintain a separate tracker outside Workday — a clear signal of platform failure
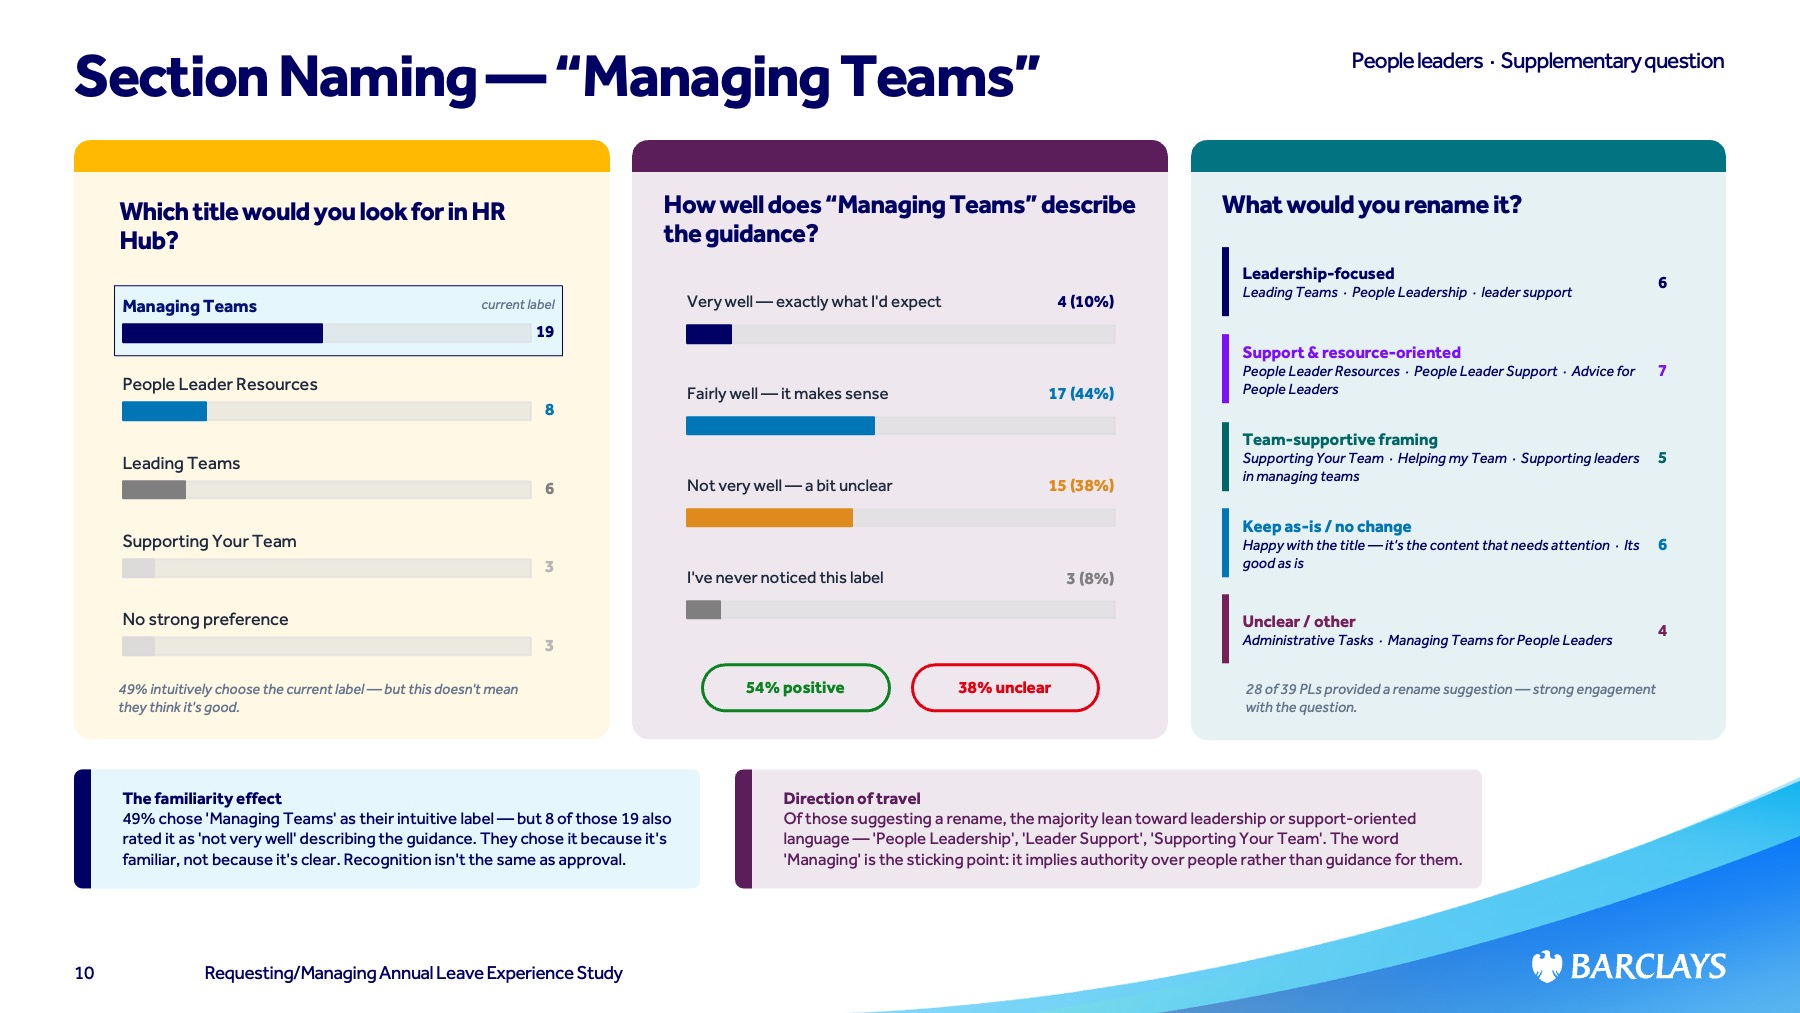
The navigation label study — evidence that drove the decision to change
Reflection
What good research
actually looks like.
The thing I'm proudest of in this study isn't the sample size or the methodology — it's that the findings changed something. Too much research gets filed. This one got presented, debated, and acted on.
That happens when you design research with the stakeholder conversation in mind from the beginning. What decision are we trying to make? What would change our minds? What format will make the findings impossible to ignore? These questions shaped every choice in the programme design.
The navigation label finding is a small but perfect example. A contested, opinion-led debate — resolved in one study. That's what evidence-based design looks like in practice.